EBITDA TO SALES
CONDITION
| Year : | 2006 |
| Your ratio : | 0.13 |
| Industry Avg : | 0.0 |
| EBITDA : | $125,552 |
| Total Assets : | $1,001,557 |
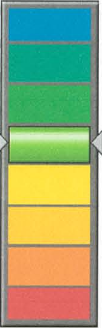
GRAPH
EBITDA TO SALES
EBITDA can be used to analyze the profitability between companies and industries. Because it eliminates the effects of financing and accounting decisions.EBITDA can provide a relatively good "apples-to-apples" comparison. For Example, EBITDA as a percent of sales(the higher the ratio, the higher the profitability)can be used to find companies that are the most efficient operators in an industry. The ratio can be used to evalute different industry trends over time. Because it removes the impact of financing large capital investments and depreciation from the analysis, EBITDA can be used to compare the profiability trend of "heavy" industries(like automobile manufactures) to high-tech companies.
EBITDA as a percent of sales(the higher the ratio, the higher the profitability)can be used to find companies that are the most efficient operators in an industry. The ratio can also be used to evalute different different industry trends over time. Because it removes the impact of financing large capital investments and depreciation from the analysis, EBITDA can be used to compare the profitability trends of, say. "heavy" industries (like automobile manufactures)to hi-tech companies.
This earnings measure is of particular interest in cases where companies have large amounts of fixed assets which are subject to large amortization charges (such as a comapny that has purchased a brand or a company taat has recently made a large acquisition).